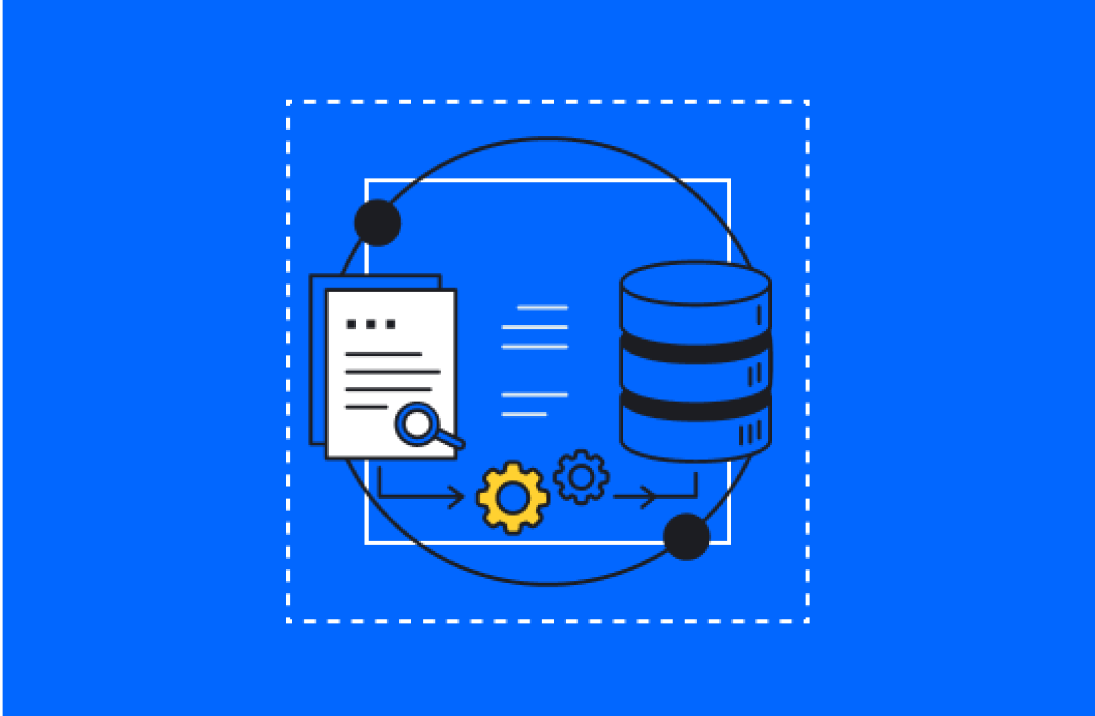
Data mining is the process of extracting valuable insights from large data sets. This can be done by humans, but most organizations use software and AI to mine data more efficiently.
Once insights have been discovered, it's important to structure reports so that the mined information is easy for your audience to understand, especially if they aren't well-versed in the technicality of data mining. Data scientists may be able to understand the information contained within their report easily, but stakeholders, such as other business leaders, may not.
In this blog post, we will discuss data mining and how to report on it effectively.
What is Data Mining?
The goal of data mining is to find patterns and relationships in data that can be used to make better business decisions. Data miners use a variety of methods, including machine learning, data visualization, and statistics, to analyze data.
The insights that are discovered can be used to improve business processes, make better decisions about products and services, and identify new market opportunities.
Data mining is used in a variety of industries, including finance, healthcare, retail, and manufacturing. It can help businesses in several ways, including:
- Improving customer service
- Identifying new market opportunities
- Improving business processes
- Reducing fraud
- Improving decision making
How Does Data Mining Work?
The data mining process starts by cleaning raw data so that it is usable in each context, such as a business context. Then, the data miner can start identifying patterns through a modeling process. Models are created by inputting data into algorithms that learn how to find patterns and relationships.
Generally, a data set is first divided into two parts: the training data and the test data. The training data is used to create the model, and the test data is used to verify the accuracy of the model.
The data miner then uses the model to make predictions on new data sets, find patterns, and generate additional insights.
How to Report Your Data Mining Results
If you're presenting data mining results to a group of data scientists, you can be more technical in your language and explanation. However, if you're presenting data mining results to business leaders who are not data scientists, you'll need to word and structure your report in a way that makes it accessible and usable to them.
For example, it's important to present data mining results in a way that is easy to follow. You can do this by using data visualizations, such as graphs and charts.
In your report, you should also include:
- A description of the data set
- The methods used to analyze the data
- The key findings of the data analysis
- How the data analysis can be used to improve the business
- The limitations of the data analysis
Ensure the sections of the report follow in a logical order as well. For example, you could start with an introduction, followed by a small list of the most important insights drawn from the data. These should be easy for your audience to understand and jot down.
Once you've provided your initial insights, you can do a deeper analysis of the results, focusing on specific topics in each section. End with a conclusion and key suggestions with how the audience can use the data as part of the business. You can add your methodology to an appendix—this information should be present, but it may not be as important to the audience.
To make data mining results more understandable for non-experts, follow these tips as well:
- Use plain language: Data mining results can be difficult to understand for those who are not data scientists. Use plain language and avoid technical jargon.
- Use data visualizations: Data visualizations are a great way to communicate data mining results. They can help non-experts understand complex data sets and patterns.
- Explain the business context: Data mining insights should be interpreted in the context of the business problem that is being solved.
Get More Value from Your Data
Are you getting ready to launch a data mining operation? Contact us at Aptitude 8 to learn more about how you can draw value from your data.


